BigQuery · Medallion · Data Engineering
We turned 14 years of Stack Overflow data into business insights for less than a cup of coffee
23 million questions, 3 data layers, $0.032 — here's how we did it.
Most companies have data. Very few have insights.
The difference is not the volume of data you collect — it is what you do with it before anyone tries to use it. Raw data without structure is noise. Structured, clean, and organized data is where decisions are made.
To prove this, we took one of the most well-known public datasets in the world — 14 years of Stack Overflow questions, from 2008 to 2022 — and built a production-grade data architecture on top of it using Google BigQuery. No shortcuts. No toy examples. 23 million records, real architecture, real costs.
The following insights are based on 23 million Stack Overflow questions analyzed through a Medallion architecture in Google BigQuery. Explore the full interactive dashboard with all charts at: simov-labs.github.io/so-benchmark.
The dataset
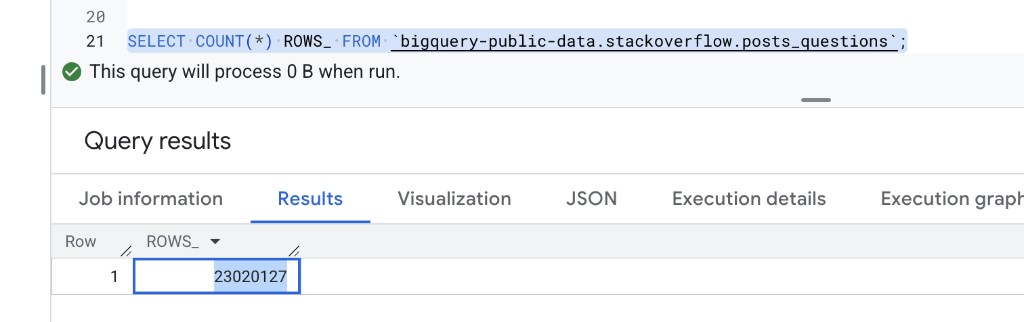
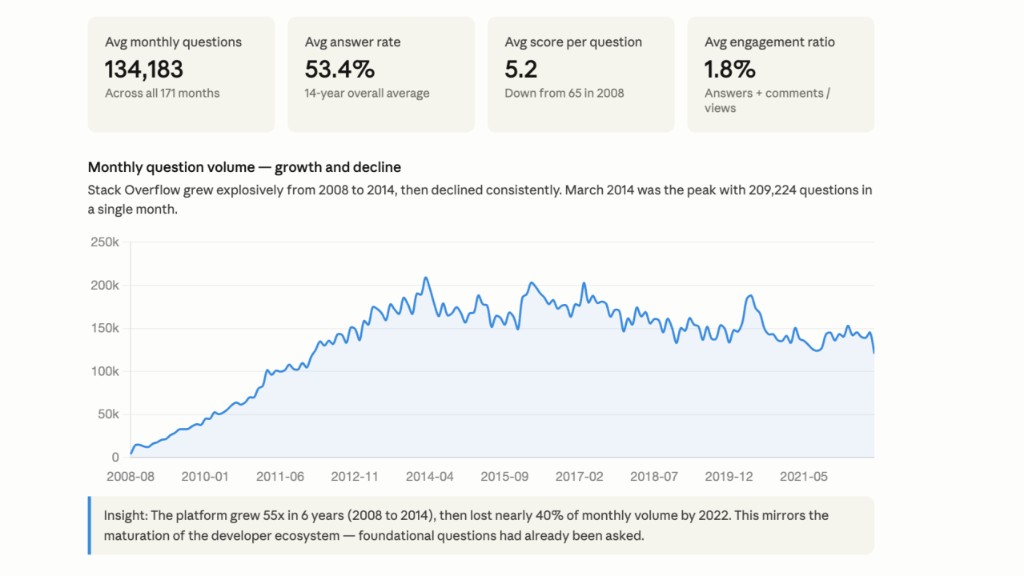
Stack Overflow is where developers go when they are stuck. Every question, every tag, every vote is a signal. The dataset we used contains 23,020,127 questions spanning 14 years, covering topics from Python and JavaScript to machine learning and cloud infrastructure.
It is a rich, real-world dataset — messy enough to be interesting, large enough to be meaningful.
The architecture — Medallion explained simply
Think of data like raw materials in a factory. You receive raw materials, you process and refine them, and you deliver a finished product ready for use. That is the Medallion architecture. Three layers, each one adding value to the previous.
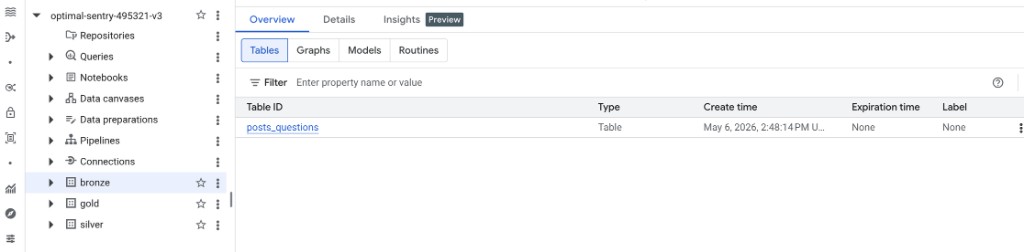
Bronze — raw data with control columns
We added audit fields like when the data was loaded, where it came from, and a unique batch ID. Nothing is transformed. Everything is traceable.
Silver — cleaned and enriched data
We removed unnecessary columns, normalized dates, exploded tags from a pipe-separated string into a proper array, calculated engagement ratios, and classified each question into a quality tier: high impact, normal, or low quality.
Gold — business-ready aggregations
From 23 million rows down to 171 records — one per month from 2008 to 2022 — with metrics like answer rate, average score, average views, and engagement trends. This is what you connect to your BI tool.
Why BigQuery
BigQuery's business model is straightforward: you pay for the bytes your queries scan, not for the number of queries you run. You can run a thousand queries and pay almost nothing if your data is well structured, or run one query and pay a lot if it scans everything.
This is why the architecture matters. Every layer we built reduced the bytes scanned in subsequent queries:
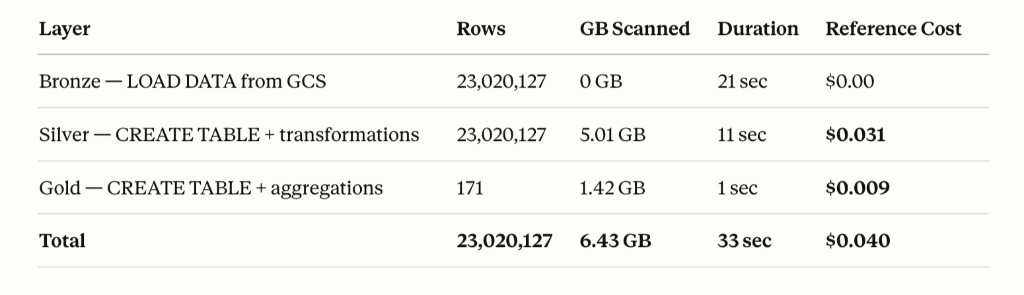
- Bronze — scanned 0 GB. Loaded directly from a GCS bucket at no processing cost.
- Silver — scanned 5 GB. Reading only from Bronze, without the heavy HTML body column.
- Gold — scanned 1.4 GB. Aggregating from Silver into 171 clean monthly records.
BigQuery is also fully serverless. No clusters to configure, no warehouses to size, no infrastructure to manage. You write SQL and it runs.
What did it actually cost
Building the full Medallion architecture — Bronze, Silver, Gold — cost $0.032 in query processing. Less than four cents. Reference pricing: cloud.google.com/bigquery/pricing.
Each query to the Gold layer costs $0.00005. That is less than a fraction of a cent every time someone asks a business question against 14 years of data.
Monthly storage for the full architecture runs approximately $0.92. That is the ongoing cost of keeping 23 million records structured, clean, and ready for analysis.
Automation and version control
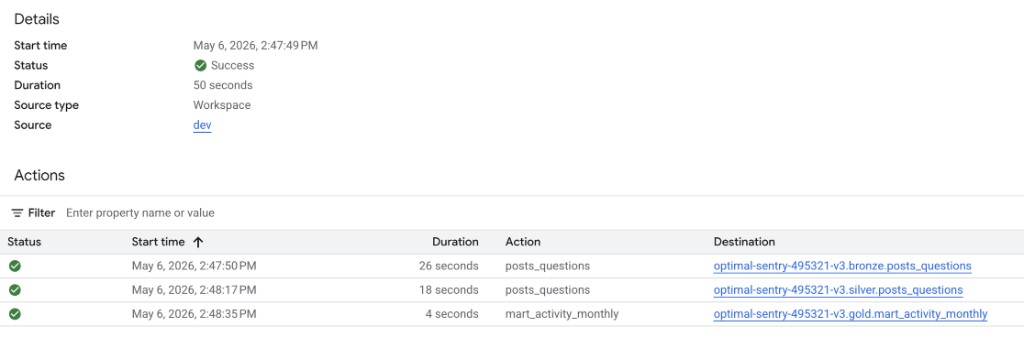
We automated the entire pipeline using Dataform, Google Cloud's native orchestration tool for BigQuery. Each layer is defined as a SQL model with explicit dependencies — Silver will never run before Bronze finishes, and Gold will never run before Silver is complete.
Every model includes column-level documentation so anyone on the team knows exactly what each field means and where it comes from. The full pipeline is versioned and available on GitHub: github.com/SIMOV-LABS/so-benchmark.
What this means for your business
The technology is not the hard part. The hard part is deciding what structure your data needs before it reaches your analysts, your dashboards, or your models.
A well-designed data architecture reduces cost, improves query speed, and makes your data trustworthy. The Medallion pattern is one of the most proven approaches to get there — and as this exercise shows, the cost of building it right is lower than most people expect.
The question is not whether you can afford to build this. The question is whether you can afford not to.
See the full interactive dashboard → simov-labs.github.io/so-benchmark
At Simov Labs we help companies choose the right data platform for their needs. Not every company needs the same solution — and we can help you find yours.
Let's talk.
Tags: #BigQuery #DataEngineering #MedallionArchitecture #ModernDataStack #DataPlatform #CloudData #Dataform #BusinessIntelligence #DataStrategy #GoogleCloud